
The UCI Had the Cable Stats All Along. UniFi Just Wasn't Showing Them.
Ubiquiti's UniFi Cable Internet modem is a nice piece of hardware with one baffling omission: the modem knows all of the useful DOCSIS diagnostics, but the UniFi Network interface exposes almost none of them.
The front-panel display can show connection information, but that is not a monitoring system. What I wanted was the normal cable-modem view: downstream power and MER, upstream transmit power, OFDM/OFDMA lock state, corrected and uncorrectable codewords, and an event log that explains why an otherwise "healthy" connection occasionally feels bad.
At first this looked like a dead end. There was no useful local web interface, no accessible SNMP endpoint, and the normal controller device API returned only a small cable-state object.
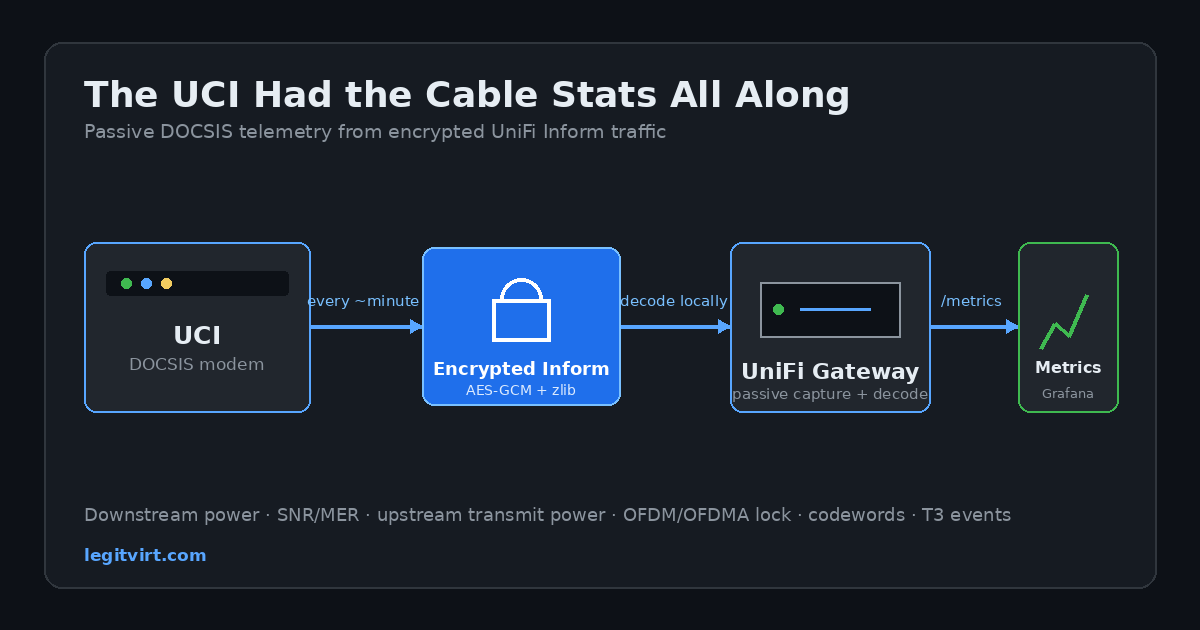
It turns out the missing data was already crossing the network every minute or so.
The Discovery: Follow the Inform Traffic
Every adopted UniFi device periodically sends an Inform message to its controller. This is the management heartbeat UniFi uses to learn device state and push configuration.
The UCI does the same thing. It sends its Inform message across the short Ethernet link to the gateway's WAN interface. The message is not ordinary JSON: it is an HTTP POST /inform request with an application/x-binary body that is encrypted and compressed.
The first useful clue was not in the UI. It was in a passive packet capture on the gateway:
UCI
  └─ encrypted HTTP POST /inform
       └─ gateway WAN interface
            └─ UniFi Network controller
The UCI does not need an inbound management service for this to work. It initiates the connection itself, reports its state, and receives controller instructions in response. That is why looking for an open web page or SSH server on the modem did not reveal much.
The important part: the modem's Inform payload contains fields that the controller receives but does not expose in the device JSON returned to the web application.
What Is Inside an Inform Packet
Modern UniFi devices use an Inform frame beginning with the TNBU magic value. The relevant parts are:
TNBU frame
├─ protocol metadata and device MAC
├─ encryption flags
├─ IV / nonce
├─ encrypted payload length
└─ AES-GCM encrypted payload
     └─ zlib-compressed JSON
The controller maintains a per-device Inform key, commonly called x_authkey in UniFi's device record. With that key, the packet metadata as authenticated data, and the frame nonce, the payload decrypts cleanly with AES-128-GCM. After zlib decompression, it is just JSON.
That JSON is the interesting part. It includes structures such as:
{
  "ds_table": [...],
  "ofdm_table": [...],
  "us_table": [...],
  "ofdma_table": [...],
  "ev_log_docsis": "...",
  "ci_state_table": {...}
}
In other words: the data exists, the modem sends it, and the controller sees it. The normal UniFi UI simply declines to render it.
The Stats That Were Hiding in Plain Sight
The decoded payload exposes the cable diagnostics I wanted in the first place.
Downstream SC-QAM
For each downstream channel, the payload includes:
- channel ID and center frequency
- lock state
- modulation, such as QAM256
- received power in dBmV
- SNR/MER
- corrected and uncorrectable codeword counters
- reported channel speed
A typical metric emitted by the exporter looks like this:
uci_docsis_channel_power_dbmv{
  direction="downstream",
  technology="scqam",
  channel="7",
  frequency_mhz="..."
} 3.9
The UCI firmware reports SC-QAM SNR with a negative sign. It is clearly a signed representation rather than a physically negative SNR: a QAM256 channel operating at roughly 40 dB is healthy, while a genuine -40 dB SNR would not be a working cable connection. The exporter normalizes this to a positive physical magnitude for Grafana.
DOCSIS 3.1 OFDM and OFDMA
The payload also contains separate tables for DOCSIS 3.1 wide channels:
- downstream OFDM lock state, center frequency, power, and reported capacity
- upstream OFDMA lock state, active subcarrier range, power, symbol configuration, and reported capacity
This is useful because a connection can have perfectly reasonable legacy SC-QAM values while an OFDM or OFDMA channel is degraded, unlocked, or repeatedly reassigned.
Upstream Diagnostics and the Event Log
The upstream side is where intermittent cable problems often reveal themselves first. The Inform payload exposes:
- upstream SC-QAM frequency, modulation, and transmit power
- OFDMA state and transmit-power representation
- upstream profile changes
- DOCSIS reinitialization reason
- the modem's DOCSIS event log
That event log matters. It can contain the difference between "the dashboard said WAN was up" and "the modem reported repeated ranging timeouts on the return path." Those brief upstream failures may not create a long enough outage to trigger a general availability alarm, but they can still cause real packet loss, voice-call glitches, upload stalls, or game disconnects.
The Security Model: Passive, Local, and Read-Only
This project is deliberately designed not to talk to the modem.
The collector:
1. SSHes to the UniFi gateway using a dedicated key.
2. Runs a short packet capture on the gateway's WAN interface.
3. Captures the UCI's already-existing Inform packet.
4. Decrypts and parses it locally.
5. Exposes metrics to Prometheus.
It does not:
- send a packet to the UCI
- change provisioning or DOCSIS configuration
- reboot the modem
- inject Inform commands
- persist packet captures
The controller-issued Inform key is sensitive and must be treated as a device credential. It belongs in a root-readable environment file or secret store, never in source control, screenshots, blog posts, or issue reports.
The SSH key should also be dedicated to the collector. The cleanest deployment gives it only the access needed to run the capture command on the gateway.
Turning It Into Prometheus Metrics
I built a small Docker exporter around the decoder. It performs capture and decoding in a background loop, retains only the current parsed document in memory, and serves Prometheus metrics on /metrics.
The container workflow is intentionally boring:
Docker on a monitoring host
  └─ SSH key authentication to the gateway
       └─ tcpdump of UCI Inform traffic on WAN interface
            └─ AES-GCM decrypt + zlib decompress
                 └─ Prometheus /metrics endpoint
                      └─ Prometheus and Grafana
A deployment needs a few environment values:
UDM_HOST=<gateway-management-address>
UDM_USER=<dedicated-collector-user>
UDM_KEY_PATH=/config/gateway_capture_key
UDM_CAPTURE_INTERFACE=<wan-interface>
UCI_LINKLOCAL=<uci-link-local-address>
UCI_AUTHKEY=<hex-encoded-per-device-inform-key>
The image itself needs only Python, OpenSSH client tooling, cryptography, and the Prometheus Python client. The capture runs on the gateway, not in privileged mode inside the collector container, so the container does not require host networking or packet-capture capabilities.
A simplified run command looks like this:
docker run -d \
  --name uci-inform-exporter \
  --restart unless-stopped \
  -p 9878:9878 \
  --env-file /secure/path/collector.env \
  -v /secure/path/gateway_capture_key:/config/gateway_capture_key:ro \
  uci-inform-exporter:latest
Then add the exporter to Prometheus as an ordinary scrape target:
- job_name: uci-inform-exporter
  static_configs:
    - targets: ['exporter-host:9878']
Grafana Panels That Actually Help
The dashboard should be built around changes over time, not a wall of static channel values.
Downstream health
- per-channel downstream power, with min/max spread
- worst downstream SNR/MER
- SC-QAM and OFDM locked-channel count
- corrected and uncorrectable codeword rate, not only a lifetime counter
- a table for the current worst channel by error delta
Upstream health
- SC-QAM transmit power: min, average, and maximum
- OFDMA lock state and reported power
- active upstream channel count
- modulation fallback detection
- upstream profile-change annotations
The "call your cable company" panel
- T3 timeout count in the last hour, day, and week
- T4 timeout count, if present
- DOCSIS event-log annotations
- modem uptime and reinitialization reason
- WAN packet loss and latency overlaid with DOCSIS events
This is the useful combination. A generic WAN monitor can tell you whether the internet is completely unavailable. DOCSIS telemetry can explain why a connection is technically up but objectively bad.
Troubleshooting the Collector
The capture contains no Inform packet
Confirm the gateway interface and UCI link-local address. The UCI's management traffic is usually on the gateway's WAN-facing interface, not on the ordinary LAN bridge. Capturing from the wrong interface will look completely quiet.
Also give the capture enough time. Inform intervals are not guaranteed to be exactly one minute, and a short capture can miss the next heartbeat.
The payload cannot be decrypted
The usual causes are:
- wrong
x_authkey - a device was readopted and received a new key
- a packet from a different UniFi device was selected
- an incomplete TCP stream was captured
The frame should start with TNBU. Modern devices set the encryption/compression flags for AES-GCM and zlib. The key is hex encoded in the controller record and must be decoded to raw bytes before use.
The JSON decodes but metrics are empty
Check that the payload contains the expected ds_table, us_table, ofdm_table, and ofdma_table fields. A modem can legitimately have unlocked placeholder channels with zero frequency or power; those should be graphed separately from active channels rather than treated as failures by themselves.
The container can capture but cannot SSH after a gateway update
UniFi OS updates can change SSH configuration and may remove manually installed keys. Use a dedicated key, document how it is installed, and check collector health with a metric such as uci_inform_capture_success so a broken management path is obvious.
Why This Is Worth Publishing
The frustrating part is not that the UCI lacks diagnostics. It plainly has them. The modem is doing the work, reporting the data, and delivering it to the controller. The gap is between the controller's internal management plane and what the product chooses to show users.
This exporter is a practical workaround for owners who want observability without opening the modem, replacing it, or sending any unsupported command to it. It also demonstrates that better UCI telemetry in UniFi Network is not a hardware limitation. Most of it is already there.
The code is now available on GitLab. It includes the Docker exporter, Grafana dashboard, installation guide, and security guidance for restricted capture access.
Until then, the headline is simple: if you own a UCI and thought its DOCSIS telemetry was trapped behind a tiny front-panel screen, it is not. It is on the wire.
Thank you for sharing this. I got it all setup, only critique was the install was missing how to get the uci key for decrypting the data.
i.e.:
ssh into unifi
`mongo –port 27117`
“`
db.device.findOne(
{ mac: “UCI_MAC_ADDRESS” },
{ _id: 0, mac: 1, name: 1, x_authkey: 1 }
)
“`
and then the ssh command bounded script:
/root/uci-inform-capture
“`
#!/bin/sh
exec /usr/bin/timeout 75 /usr/bin/tcpdump -i eth8 -nn -s 0 -w – \
‘ip6 and host UCI_LINK_LOCAL_ADDRESS and tcp port 8080’
“`
and then in authorized keys:
“`
command=”/root/uci-inform-capture”,no-port-forwarding,no-agent-forwarding,no-X11-forwarding,no-pty ssh-ed25519 AAAA… $PUBLIC_KEY
“`
But once I got those things going, I was able to get this all setup and pulling into prometheus / grafana. thank you SO MUCH for sharing. Used this to help me debug / show exactly why I’m having crazy packet re-ordering issues on the upload path of my cable internet.