
I have infrastructure in two places and until recently had a clear view into exactly none of it.
At home there’s an Unraid server built on a Supermicro CSE-847 with 36 drive bays and a few hundred TB of usable storage, running every Docker container I’ve ever thought was a good idea at the time. Plex runs as a Docker container on the same box with an Intel Arc A310 passed through directly for hardware transcoding. It lives on its own macvlan network with a dedicated IP on a media VLAN, which keeps Plex traffic isolated from everything else on the LAN and makes me feel like I know what I’m doing. The UniFi stack handles networking throughout. It’s the kind of home setup that started as “I’ll just run a few containers” and quietly evolved into something that absolutely requires a proper monitoring stack.
Then there’s the remote side. I rent rack space at a data center where I run a four-node Proxmox cluster on a Dell PowerEdge FX2S chassis with three FC630 blades and one FC640, each loaded with 256GB of RAM and backed by NVMe and SATA SSD storage. It’s the kind of enterprise iron that ends up on eBay for a fraction of what it originally cost and makes you feel slightly unhinged for running it as a homelab, in the best possible way. Those four nodes run pve01 through pve04, and sitting separately in the same rack is a Dell C6420 that serves as pve-nas01, a dedicated NAS box with 4TB of SATA SSD providing NFS-connected storage to the cluster. Rounding things out are a handful of VMs handling jobs like VPN endpoints, a seedbox, and GPU licensing, and more recently a Palo Alto VM-Series firewall after I finally got tired of running everything flat on public IPs. The whole thing connects back home over a WireGuard site-to-site tunnel through the UniFi Dream Machine Pro Max.
For a long time my monitoring strategy was to SSH into whatever was broken and poke around until I found something suspicious. That approach has no historical data, no baselines, no way to correlate events across hosts, and absolutely no way to know something is wrong until it’s already been wrong for a while. It’s fine until it isn’t, and then it really isn’t.
Here’s how I built an observability stack that covers both locations, all hosts, and all logs, and what I learned doing it.
The Stack
The tooling here is deliberately standard. Standard means it works, has community dashboards you can import instead of building from scratch, and integrates with everything:
- Prometheus for metrics collection and storage
- Loki for centralized log aggregation
- Grafana for dashboards and visualization
- Promtail as the log shipping agent on every host
- node_exporter for system metrics on every Linux host
- pve-exporter for Proxmox cluster metrics via the PVE API
Everything runs as Docker containers on Unraid except for the agents on the remote hosts, which run as binaries managed by systemd. Simple, boring, and it works.
The Infrastructure Map
Here’s what we’re actually monitoring across both sites:
Home (10.10.0.x / 10.10.4.x)
- Unraid NAS (10.10.0.5) — the hub, runs all Docker containers
- Plex (10.10.4.10) — Docker container on Unraid, Intel Arc A310 passed through for transcoding, macvlan’d onto its own media VLAN
Remote DC (10.20.0.x / 10.20.50.x)
- pve01 through pve04 (10.20.0.11 to 10.20.0.14) — Proxmox cluster nodes on the FX2S blades
- pve-nas01 (10.20.0.20) — Dell C6420, dedicated NAS with 4TB SATA SSD, NFS-connected storage for the cluster
- Various VMs: gpu-license, seedbox, vpn-a, vpn-b, app01, auth01, and a few others
- Palo Alto VM-Series sitting in front of all public-facing traffic
The glue: WireGuard site-to-site VPN. All monitoring traffic between home and the DC rides this tunnel.
Prometheus: Scraping Metrics from Everything
Prometheus runs as a Docker container on Unraid and scrapes metrics from every host on a 30-second interval. The scrape targets split cleanly between home and the DC:
scrape_configs:
  - job_name: 'unraid'
    static_configs:
      - targets: ['10.10.0.5:9100']
        labels:
          host: 'unraid'
          location: 'home'

- job_name: 'plex'     static_configs:       - targets: ['10.10.4.10:9100']         labels:           host: 'plex'           location: 'home'

- job_name: 'pve-hosts'     static_configs:       - targets:           - '10.20.0.11:9100'           - '10.20.0.12:9100'           - '10.20.0.13:9100'           - '10.20.0.14:9100'         labels:           location: 'dc'

- job_name: 'pve-cluster'     metrics_path: /pve     params:       cluster: ['1']       node: ['1']     static_configs:       - targets: ['10.10.0.5:9221']         labels:           location: 'dc'
That last job is pve-exporter, a container that talks to the Proxmox API and translates cluster state into Prometheus metrics including per-node CPU and RAM, per-VM resource usage, storage pool capacity, and cluster health. Scraping it through the WireGuard tunnel from Unraid means nothing extra needs to run in the DC just for Prometheus.
One thing worth noting: the public-facing VMs behind the Palo Alto are not scraped by Prometheus. There’s no inbound path from home to their node_exporter ports, and I’m not punching firewall holes just for metrics. Prometheus is pull-based so it needs a reachable target, and these don’t have one. Logs are a different story, which is covered below.
Deploying node_exporter to 9+ Hosts
On hosts I have SSH access to, deploying node_exporter is straightforward. Drop the binary, write a systemd unit, done:
curl -sL https://github.com/prometheus/node_exporter/releases/download/v1.9.0/node_exporter-1.9.0.linux-amd64.tar.gz | tar xz
mv node_exporter-1.9.0.linux-amd64/node_exporter /usr/local/bin/
[Unit]
Description=Node Exporter
After=network.target

[Service] Type=simple ExecStart=/usr/local/bin/node_exporter Restart=always

[Install] WantedBy=multi-user.target
The VMs were more interesting because I don’t have SSH keys distributed to them from Unraid. They were stood up over time in various ways and key distribution was inconsistent. The solution was the Proxmox API’s guest-exec endpoint, which runs commands inside VMs through the QEMU Guest Agent without needing SSH at all. It works well, but Proxmox 9.1 has some quirks worth knowing about before you spend an hour debugging silent failures. Every POST request needs a valid CSRF token from a fresh auth request. The arg parameter for passing command arguments is broken in PVE 9.1 and you have to pipe scripts in via input-data instead. Several VMs were also missing unzip, which caused install scripts to fail silently at the extraction step. Once you know those three things, mass deployment via the API is actually pretty clean.
pve-exporter: Proxmox Cluster Metrics
pve-exporter is one of the most useful pieces of the stack. It runs as a Docker container on Unraid, authenticates to the Proxmox API, and exposes cluster-level metrics that Prometheus scrapes every 30 seconds. You get cluster quorum status, per-node CPU and RAM, per-VM resource usage, and storage pool capacity across the whole cluster. Paired with the community Proxmox dashboard (ID 10347) in Grafana, the entire four-node cluster is visible in one view without logging into Proxmox directly.
The config is minimal:
default:
  user: root@pam
  password: <your_pve_password>
  verify_ssl: false
Point Prometheus at it with metrics_path: /pve and you’re done.
Loki and Promtail: Logs from Everything
This is where things get more interesting. Loki’s model is push-based, meaning Promtail agents on each host ship logs to Loki rather than Loki pulling them. That matters because it works even for hosts that Prometheus can’t scrape. The public-facing VMs with no inbound path for metrics can still push logs outbound just fine. Log coverage is complete across the entire infrastructure even where metrics coverage has gaps.
Promtail is deployed on 11 hosts:
| Host | Location | Logs Collected |
|---|---|---|
| Unraid | Home | Docker container logs, syslog, auth, network device syslogs |
| Plex | Home | journald, syslog, auth |
| pve01 through pve04 | DC | journald, syslog, auth, pveproxy |
| gpu-license | DC | journald, syslog, auth |
| seedbox | DC | journald, syslog, auth |
| app01 | DC | journald, syslog, auth |
| auth01 | DC | journald, syslog, auth |
| vpn-a, vpn-b | DC | journald, syslog, auth |
Getting Rid of Splunk
I was running a Splunk container on Unraid to receive syslog from the UniFi gear. It worked, but Splunk is comically over-engineered for this use case and the container wasn’t small. It turned out rsyslogd was already receiving those syslogs and writing them to per-device files under /mnt/user/appdata/. Adding a Promtail job to tail those files and ship them to Loki gave me the same data at a fraction of the resource overhead, with network device logs landing in the same place as everything else. Splunk container deleted.
Palo Alto Logs
After migrating the DC VMs behind the PA firewall, I needed syslog from the PA going somewhere useful. The setup routes through the management interface over a WireGuard segment to Unraid’s rsyslogd on port 514, then Promtail picks it up with a network-syslog job and ships it to Loki.
Now PA allow/deny logs, threat events, and system messages all land in the same place as application logs. Being able to query across both in one interface is genuinely useful when you’re trying to figure out why something is timing out and you’re not sure if it’s the app or the firewall.
The Dashboard
The custom Infrastructure Overview dashboard in Grafana is built around one goal: open it and immediately know if anything is on fire.
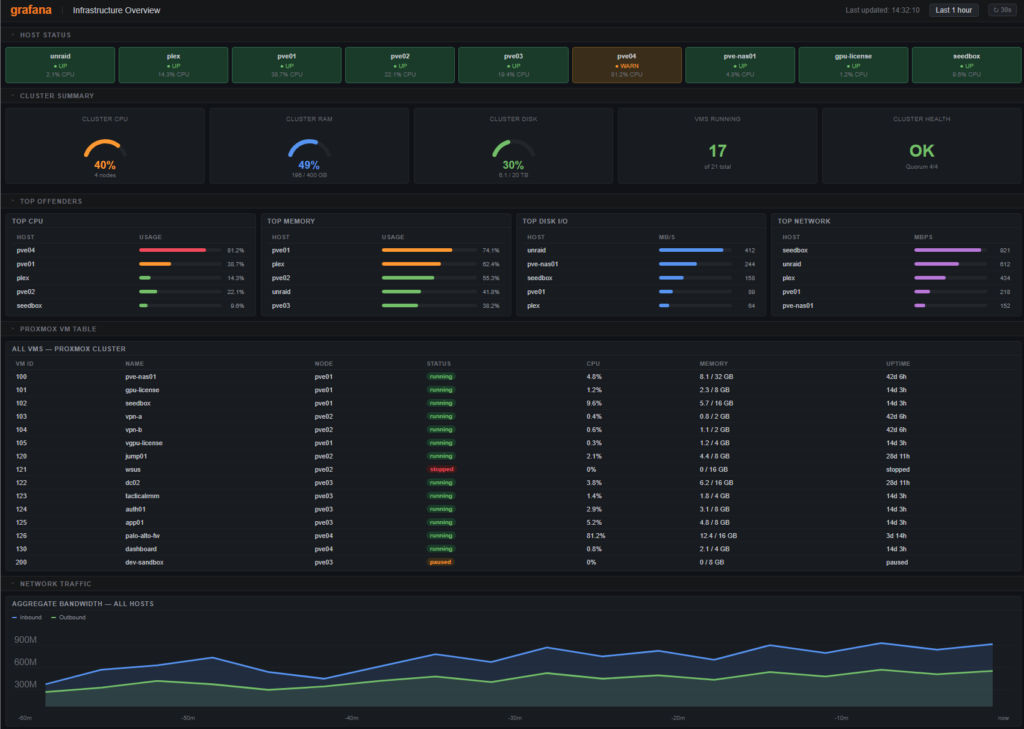
Row 1 — Host Status Tiles are color-coded UP/DOWN tiles for every monitored host. Green means node_exporter is responding and Prometheus is scraping it successfully. Clicking any tile drills into the full Node Exporter dashboard for that host. This row answers “is everything running” in about two seconds.
Row 2 — Cluster Summary shows aggregate Proxmox cluster CPU, RAM, and disk utilization as gauges, plus VM count and cluster health from pve-exporter. If the cluster is under pressure or a node has dropped out of quorum, it shows here first.
Row 3 — Top Offenders lists the top 5 hosts by CPU usage, memory usage, disk I/O, and network utilization. This is where you find the VM that’s quietly hammering storage or the process that ran away overnight.
Row 4 — VM Table is a table panel showing every Proxmox VM with status, CPU percentage, and memory usage, sorted by CPU so the busy ones are at the top.
Row 5 — Network Traffic shows aggregate bandwidth in and out across all monitored hosts over time, useful for spotting unexpected spikes or confirming a backup job actually ran.
Row 6 — Error Log Stream is a live Loki panel showing recent errors across all hosts. Instead of SSH-ing into machines and grepping logs one at a time, this is the first place I look when something feels off.
The whole thing auto-refreshes every 30 seconds and genuinely looks like something that belongs in a NOC, which is satisfying given that it’s running in a basement and a rented rack at a colocation facility.
The PA Syslog Dashboard
As a separate view, I built a Grafana dashboard specifically for Palo Alto logs in Loki with panels for log volume over time by source, PA allowed vs denied traffic as a stacked bar, threat and system events broken out separately, and a live log stream filtered to PA traffic.
This one paid for itself immediately during the DC migration. The PA’s traffic logs were the only way to see that security policy was evaluating pre-NAT destination IPs instead of post-NAT, which was silently dropping traffic that looked like it should be allowed. Having that visible in Grafana instead of digging through the PA’s built-in log viewer made the debugging loop significantly faster.
What This Actually Solved
The monitoring stack wasn’t built for its own sake. It directly unblocked real problems.
When my media pipeline broke and Sonarr and Radarr were silently failing to import for months, Loki was how I found it. Querying container logs across every Docker container on Unraid took about 30 seconds and the logs showed exactly what was failing and why: a remote path mapping mismatch and a permissions issue stacked on top of each other. Without centralized logging that would have been a long session of SSH-ing into containers and grepping log files manually, probably missing things along the way.
During the DC migration to the Palo Alto, the traffic logs in Loki showed that proxy ARP wasn’t working as expected on the KVM-based VM-Series, that security policy was matching pre-NAT IPs, and that some VMs were having their WireGuard sessions interfered with by stateful inspection on both ends of the tunnel. Debugging a problem that spans a firewall, a hypervisor, and a WireGuard tunnel is miserable without logs. With Loki it was at least possible to correlate events and form a working theory.
What’s Next
The public-facing VMs behind the PA still don’t have Prometheus coverage. The right fix is probably a Prometheus push gateway running somewhere reachable, or adding a monitoring VLAN NIC to the relevant VMs so they’re accessible without going through the WAN path. For now, logs cover the critical visibility gap and that’s good enough.
Grafana alerting isn’t fully wired up yet either. The dashboards are there but I haven’t configured notification channels for things like host down events or disk utilization thresholds crossing 80%. That’s next on the list.
The Actual Lesson
The lesson here isn’t “use Prometheus and Loki.” You probably already knew those tools existed. The real lesson is that you can’t responsibly run infrastructure you can’t see. Every hour you operate without observability is an hour where something could be silently broken and you’d have no idea. I ran that way longer than I should have, and it cost me debugging time I could have spent on anything else.
Build the monitoring stack first, before the media server, before the VPN, before the fancy firewall. Prometheus, Loki, and Grafana take an afternoon to set up and they pay back that time immediately.
Everything here is in version control: the configs, the Promtail templates, the Prometheus scrape config, the pve-exporter setup. If a drive dies or I need to rebuild from scratch, it’s an afternoon and not a week. That’s the goal.
Configs and deployment docs live in a self-hosted Gitea instance on the home network. If you’re running a similar setup and want the Grafana dashboard JSON, drop a comment.